Pressure Calibration Terminology
Accuracy vs. Uncertainty
Precision
Repeatability
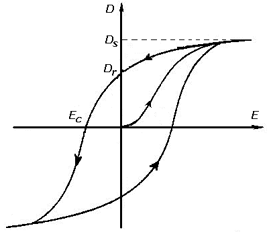
Measurement repeatability is the degree in closeness between the same measurement taken with the same procedure, operators, system, and conditions over a short period of time. A typical example of repeatability is a comparison of a measurement output at one point in the range over a certain time interval while keeping all other conditions the same including the approach and descent to the measuring point.
As Found vs. As Left Data
Adjustment
TAR vs. TUR
Why Should You Calibrate?
The simple answer is that calibration ensures standardization and fosters safety and efficiency. If you need to know the pressure of a process or environmental condition, the sensor you are relying on for that information should be calibrated to ensure the pressure reading is correct, within the tolerance you deem acceptable. Otherwise, you cannot be certain the pressure reading accuracy is sufficient for your purpose.
A few examples might illustrate this better:
Standardization in processes
A petrochemical researcher has tested a process and determined the most desirable chemical reaction is highly dependent on the pressure of hydrogen gas during the reaction. Refineries use this accepted standard to make their product in the most efficient way. The hydrogen pressure is controlled within recommended limits using feedback from a calibrated pressure sensor. Refineries across the world use this recommended pressure in identical processes. Calibration ensures the pressure is accurate and the reaction conforms to standard practices.
Standardization in weather forecasting and climate study
The barometric pressure is a key predictor of weather and a key data point in climate science. Pressure calibration and barometric pressure, standardized to mean sea level, ensures that the pressures recorded around the world are accurate and reliable for use in forecasting and in the analysis of weather systems and climate.

Safety
A vessel or pipe manufacturer provides standard working and burst pressures for their products. Exceeding these pressures in a process may cause damage or catastrophic failure. Calibrated pressure sensors are placed within these processes to ensure acceptable pressures are not exceeded. It is important to know these pressures sensors are accurate in order to ensure safety.
Efficiency
Testing has proven a steam-electric generator is at its peak efficiency when the steam pressure at the outlet is at a specific level. Above or below this level, the efficiency drops dramatically. Efficiency, in this case, equates directly to bottom line profits. The tighter the pressure is held to the recommended pressure, the more efficient the generator runs and the most cost-effective output is assured. With a calibrated high accuracy pressure sensor, the pressure can be held within a tight tolerance to provide maximum efficiency and bottom-line revenue.
How Often Should You Calibrate?
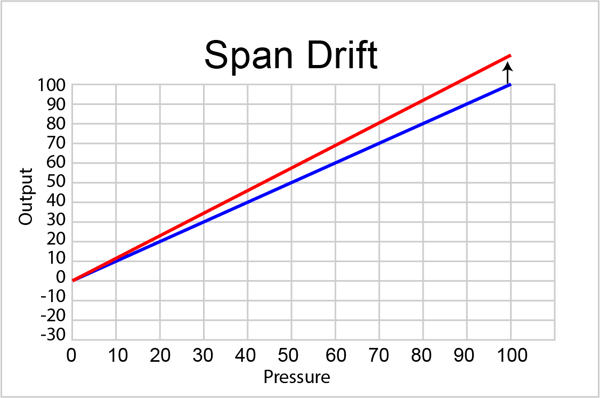
The short answer is as often as you think is necessary for the level of accuracy you need to maintain. All pressure sensors will eventually drift away from their calibrated output. Typically it is the zero point that drifts, this causes the whole calibration curve to shift up or down. There can also be a span drift component which is a shift in the slope of the curve, as seen below: 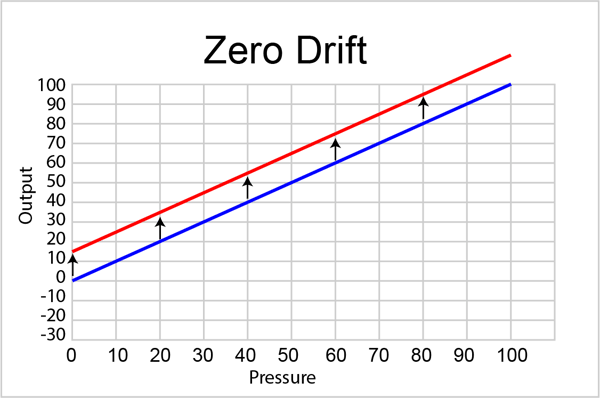
The amount of drift and how long it will take to drift outside of acceptable accuracy specification depends on the quality of the sensor. Most manufacturers of pressure measuring devices will give a calibration interval in their product datasheet. This tells the customer how long they can expect the calibration to remain within the accuracy specification. The calibration interval is usually stated in days or years and is typically anywhere from 90 to 365 days. This interval is determined through statistical analysis of products and usually represents a 95% confidence interval. This means that statistically, 95% of the units will meet their accuracy specification within the limits of the calibration interval. For example, Mensor's calibration interval specification is given as 365 or 180 days, depending on the sensor chosen.
The customer can choose to shorten or lengthen the calibration interval once they take possession of the sensor and have calibration data that supports the decision. By conducting an as-found calibration at its calibration interval the sensor will be in tolerance or out of tolerance. If it is found to be in tolerance, it can be put back in service and checked again within another calibration interval. If out of tolerance, offsets can be applied to bring it back in tolerance. In this case, the next interval can be shortened to make sure it holds its accuracy. Successive as-found calibrations will provide a history of each individual sensor and can be used to adjust the calibration interval based on this data and the criticality of the application where the sensor is used.
Where is Pressure Calibration Performed?
Instruments Used in Pressure Calibration
Deciding what instrument to use for calibrating pressure measuring devices depends on the accuracy of the DUT. For devices that ascribe to the highest accuracy achievable, the reference standard used to calibrate it should also have the highest achievable accuracy.
Accuracy of DUTs can range widely but for devices with accuracy greater than 1-5% it may not even be necessary to calibrate. It is completely up to the application and the discretion of the user. Calibration may not be deemed necessary for devices used only as a visual "ballpark" indication and are not critical to any safety or process concern. These devices may be used as a visual estimate of the process pressures or limits being monitored. To calibrate or not is a decision left to the owner of the device.
More critical pressure measuring instruments may require periodic calibration because the application may require more precision in the process pressure being monitored or a tighter tolerance in a variable or a limit. In general, these process instruments might have an accuracy of 0.1 to 1.0% of full scale.
The Calibrator
Common sense says the device being used to calibrate another device should be more accurate than the device being calibrated. A long-standing rule of thumb in the calibration industry prescribes a 4 to 1 test uncertainty ratio (TUR) between the DUT accuracy and the reference standard accuracy. So, for instance, a 100 psi pressure transducer with an accuracy of 0.04% full scale (FS) would have to employ a reference standard with an accuracy of 0.01% FS for that range.
Knowing these basics will help determine the equipment that can deliver the accuracy necessary to achieve your calibration goals. There are several levels of calibration that may be encountered in a typical manufacturing or process facility, described below as laboratory, test bench, and field. In general, individual facility quality standards may define these differently.
Laboratory
Laboratory primary standard devices have the highest level of accuracy and will be the devices used to calibrate all other devices in your system. They could be deadweight testers, high accuracy piston gauges, or pressure controllers/calibrators. The accuracy of these devices typically range from about 0.001% (10 ppm) of reading to 0.01% of full scale and should be traceable to the SI units. Their required accuracy will be determined by what they are required to calibrate to maintain a 4:1 TUR. Adherence to the 4:1 rule can be relaxed but it must be reported on the calibration certificate. These laboratory devices are typically used in a controlled environment subject to the requirements of ISO 17025, which is the guideline for general requirements for the competence of testing and calibration laboratories. Laboratory test standards are typically the most expensive devices but are capable of calibration a large range of lower accuracy devices.
Test Bench
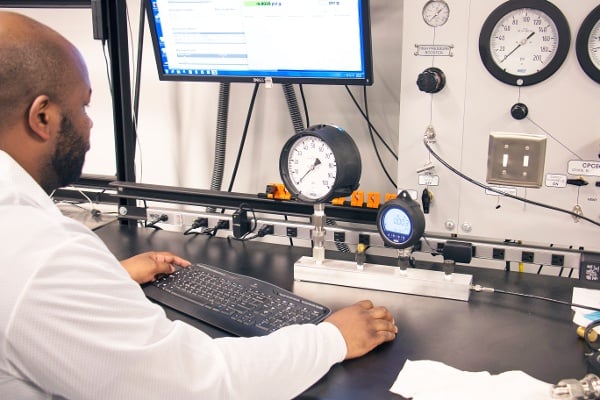
Test bench devices are used outside of the laboratory or in an instrument shop, and are typically used as a check or to calibrate pressure instruments taken from the field. They possess sufficient accuracy to calibrate lower accuracy field devices. These can be desktop units or panel mount instruments like controllers, indicators or even pressure transducers. These instruments are sometimes combined into a system that includes a vacuum and pressure source, an electrical measurement device and even a computer for indication and recording. The pressure transducers used in these instruments are periodically calibrated in the laboratory to certify their level of accuracy. To maintain an acceptable TUR with devices from the field, multiple ranges may be necessary or devices with multiple and interchangeable transducer ranges internally. The accuracy of these devices are typically from 0.01% FS to 0.05% FS and are lower cost than the higher accuracy instruments used in the laboratory.
Field
Field instruments are designed for portable use and typically have limited internal pressure generation and the capability to attach external higher pressure or vacuum sources. They may have multi-function capability for measuring pressure and electrical signals, data logging, built-in calibration procedures and programs to facilitate field calibration, plus certifications for use in hazardous areas. These multi-function instruments are designed to be self-contained to perform calibrations on site with minimal need for extraneous equipment. They typically have accuracy from 0.025% FS to 0.05% FS. Given the multi-function utility, these instruments are priced comparable to the instruments used on the bench and can also be utilized in a bench setting.
In general, what is used to calibrate your pressure instruments in your facility will be determined by your established quality and standard operating procedures. Starting from scratch will require an analysis of the cost given the range and accuracy of the pressure instruments that need to be calibrated.
How is Pressure Calibration Performed?
Understanding the process of performing a calibration can be intimidating even after you have all of the correct equipment to perform the calibration. The process can vary depending on calibration environment, device under test accuracy and the guideline followed to perform the calibration.
The calibration process consists of comparing the DUT reading to a standard's reading and recording the error. Depending on specific pressure calibration requirements of the quality standards, one or more calibration points must be evaluated and an upscale and downscale process may be required. The test points can be at the zero and span or any combination of points in between. The standard must be more accurate than the DUT. The rule of thumb is that it should be four times more accurate but individual requirements may vary from this.
Depending on the choice of the pressure standard the process will involve the manual, semi-automatic or fully automatic recording of pressure readings. The pressure is cycled upscale and/or downscale to the desired pressure point in the range, and the readings from both the pressure standard and the DUT are recorded. These recordings are then reported in a calibration certificate to note the deviation of the DUT from the standard.
Calibration Traceability and Pressure Standards
Calibration Traceability
A traceable calibration is a calibration in which the measurement is traceable to the International System of Units (SI) through an unbroken chain of comparable measurements to a National Metrology Institute (NMI). This type of calibration does not indicate or determine the level of competence of the staff and laboratory that performs the calibrations. It mainly identifies that the standard used in the calibration is traceable to an NMI. NMIs demonstrate the international equivalence of their measurement standards and the calibration and measurement certificates they issue through the framework of CIPM Mutual Recognition Arrangement (CIPM MRA).
Primary vs. Secondary Pressure Standards
Accredited Calibrations
A calibration laboratory is accredited when it is found to be in compliance with ISO/IEC 17025, which outlines the general requirements for the competence of testing and calibration laboratories. Accreditation is awarded through an accreditation body that is an ILAC-MRA signatory organization. These accreditation bodies audit the laboratory and its processes to determine the laboratory competent to perform calibrations and to issue their calibration results as accredited. Accreditation recognizes a lab's competence in calibration and assures customers that calibrations performed under the scope of accreditation conform to international standards.
The laboratory is audited periodically, to ensure continued compliance with the ISO/IEC 17025 standard.
Factors Affecting Pressure Calibration and Corrections
There are several corrections, ranging from simple to complex, which may need to be applied during the calibration of a device under test (DUT).
Head Height
If the reference standard is a pressure controller, the only correction that may need to be applied is what is referred to as a head height correction. The head height correction can be calculated using the following formula:
( ρf - ρa )gh
Where ρf is the density of the pressure medium (kg/m3), ρa is the density of the ambient air (kg/m3), g is the gravity (m/s2) and h is the difference in height (m). Typically, if the DUT is below the reference level, the value will be negative, and vice versa if the DUT is above the reference level. Regardless of the pressure medium, depending on the accuracy and resolution of the DUT, a head height correction must be calculated. Mensor controllers allow the user to input a head height and the instrument will calculate the head height correction.
Sea Level
Another potentially confusing correction is what is referred to as a sea level correction. This is most important for absolute ranges, particularly barometric pressure ranges. Simply put, this correction will provide a common barometric reference regardless of elevation. This makes it easier for meteorologists to monitor weather fronts as all of the barometers are referenced to sea level. For an absolute sensor, as the sensor increases its altitude, it will approach absolute zero, as expected. However, this can become problematic for a barometric range sensor as the reading will no longer be ~14.5 psi when vented to atmosphere. Instead, the local barometric pressure may read ~12.0 psi. However, this is not the case. The current barometric pressure in Denver, Colorado, for example, will actually be closer to ~14.5 psi and not ~12.0 psi. This is because the barometric sensor has a sea level correction applied to it. The sea level pressure can be calculated using the following formula:
(Station Pressure / e(-elevation/T*29.263))
Where Station Pressure is the current, uncorrected barometric reading (in inHg@0˚C), elevation is the current elevation (meters) and T is the current temperature (Kelvin).
For everyday users of pressure controllers or gauges, those may be the only corrections they may encounter. The following corrections apply mainly to piston gauges and the necessity to perform them relies on the desired target specification and associated uncertainty.
Temperature
Another source of error in pressure calibrations are changes in temperature. While all Mensor sensors are compensated over a temperature range during manufacturing, this becomes particularly important for reference standards such as piston gauges, where the temperature must be monitored. Piston-cylinder systems, regardless of composition (steel, tungsten carbide, etc.), must be compensated for temperature during use as all materials either expand or contract depending on changes in temperature. The thermal expansion correction can be calculated using the following formula:
1 + (αp + αc)(T - TREF )
Where αP is the thermal expansion coefficient of the piston (1/˚C) and αC is the thermal expansion coefficient of the cylinder (1/˚C), T is the current piston-cylinder temperature (˚C) and TREF is the reference temperature (typically 20˚C).
As the temperature of the piston cylinder increases, the piston-cylinder system expands, causing the area to increase, which causes the pressure generated to decrease. Conversely, as the temperature decreases, the piston-cylinder system contracts, causing the area to decrease, which causes the pressure generated to increase. This correction will be applied directly to the area of the piston and errors will exceed 0.01% of the indicated value if uncorrected. The thermal expansion coefficients for the piston and cylinder are typically provided by the manufacturer, but they can be experimentally determined.
Distortion
A similar correction that must be made to piston-cylinder systems is referred to as a distortion correction. As the pressure increases on the piston-cylinder system, it will cause the piston area to increase, causing it to effectively generate less pressure. The distortion correction can be calculated using the following formula:
1 + λP
Where λ is the distortion coefficient (1/Pa) and P is the calculated, or target, pressure (Pa). With increasing pressure, the piston area increases, generating less pressure than expected. The distortion coefficient is typically provided by the manufacturer, but it can be experimentally determined.
Surface Tension
A surface tension correction must also be made with oil-lubricated piston-cylinder systems as the surface tension of the fluid must be overcome to “free” the piston. Essentially, this causes an additional “phantom” mass load, depending on the diameter of the piston. The effect is larger on larger diameter pistons and smaller on smaller diameter pistons. The surface tension correction can be calculated using the following formula:
πDT
Where D is the diameter of the piston (meters) and T is the surface tension of the fluid (N/m). This correction is more important at lower pressures as it becomes less with increasing pressure.
Air Buoyancy
One of the most important corrections that must be made to piston-cylinder systems is air buoyancy.
As introduced during the head height correction, the air surrounding us generates pressure... think of it as a column of air. At the same time, it also exerts an upward force on objects, much like a stone in water weighs less than it does on dry land. This is because the water exerts an upward force on the stone, causing is to weigh less. The air around us does exactly the same thing. If this correction is not applied, it can cause an error as high as 0.015% of the indicated value. Any mass, including the piston, will need to have what is referred to as an air buoyancy correction. The following formula can be used to calculate the air buoyancy correction:
1 - ρa/ρm
Where ρa is the density of the air (kg/m3) and ρm is the density of the masses (kg/m3). This correction is only necessary with gauge calibrations and absolute by atmosphere calibrations. It is negligible for absolute by vacuum calibrations as the ambient air is essentially removed.
Local Gravity
The final correction and arguably the largest contributor to errors, especially in piston-gauge systems, is a correction for local gravity. Earth’s gravity varies across its entire surface, with the lowest acceleration due to gravity being approximately 9.7639 m/s2 and the highest acceleration due to gravity being approximately 9.8337 m/s2. During the pressure calculation for a piston gauge, the local gravity may be used and a gravity correction may not need to be applied. However, many industrial deadweight testers are calibrated to standard gravity (9.80665 m/s2) and must be corrected. Were an industrial deadweight tester calibrated at standard gravity and then taken to the location with the lowest acceleration due to gravity, an error greater than 0.4% of the indicated value would be experienced. The following formula can be used to calculate the correction due to gravity:
gl/gs
Where gl is the local gravity (m/s2) and gs is the standard gravity (m/s2).
The simple formula for pressure is as follows:
P = F / A = mg / A
This is likely the fundamental formula most people think of when they hear the word “pressure.” As we dive deeper into the world of precision pressure measurement, we learn that this formula simply isn't thorough enough. The formula that incorporates all of these corrections (for gauge pressure) is as follows:
Related Resources
Basics of Pressure
- A Brief Introduction to Pressure
- What is Pressure? Definition and Types Explained
- What is Differential Pressure?
- What is Vacuum Pressure?
- What is Bidirectional Pressure?
- What is Air Data?
Pressure Calibration applications
Understanding Pressure Calibration Equipment
- What is the True Cost of Owning an Automatic Pressure Calibrator?
- Navigating the World of Pressure Fitting Standards
- Serial Communication Interface: Differences Between RS-232, RS-485 and RS-422
- Data Logging and Leak Testing for Remote Monitoring
- Uncertainty in Emulation Mode
- Contamination Prevention: How to Extend Life of Pneumatic Pressure Calibrators
- Analog Output from a Digital Pressure Transducer
- The Importance of Modularity in Pressure Calibrators and Controllers
- Calibration Terms: Differences in Sensor, Transducer and Transmitter
- Five Challenges of Low Pressure Calibration
- Pressure Safety: How to Protect Devices from Overpressure
- Understanding the Importance of Control Stability
- Why is it Important to Isolate Reference Port When Calibrating Low Gauge Pressure?
Temperature Calibration
- About Temperature Calibration
- On-site Comparison Calibration for RTDs Minimize Downtime in Production
- Automation in Temperature Calibration: Why is it Important?
- How to Calibrate a Temperature Sensor

